More Related Content
Similar to Chester county msi and avg dom (18)
More from Prudential Fox & Roach, Realtors (20)
Chester county msi and avg dom
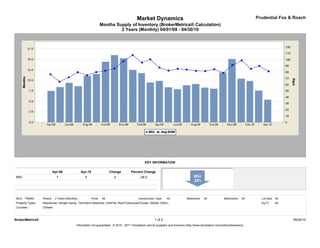
- 1. Market Dynamics Prudential Fox & Roach
Months Supply of Inventory (BrokerMetrics® Calculation)
2 Years (Monthly) 04/01/08 - 04/30/10
KEY INFORMATION
Apr-08 Apr-10 Change Percent Change
MSI 7 5 -2 -28.0
MLS: TReND Period: 2 Years (Monthly) Price: All Construction Type: All Bedrooms: All Bathrooms: All Lot Size: All
Property Types: Residential: (Single Family, Twin/Semi-Detached, Unit/Flat, Row/Townhouse/Cluster, Mobile, Other) Sq Ft: All
Counties: Chester
BrokerMetrics® 1 of 2 05/24/10
Information not guaranteed. © 2010 - 2011 Terradatum and its suppliers and licensors (http://www.terradatum.com/metrics/licensors).
- 2. Market Dynamics Prudential Fox & Roach
Months Supply of Inventory (BrokerMetrics® Calculation)
2 Years (Monthly) 04/01/08 - 04/30/10
Time # For Sale Last # Under
Period MSI NAR MSI Day of Month Contract # Sold
Apr-10 5.4 9.5 3,902 724 411
Mar-10 7.6 10.5 3,798 502 363
Feb-10 9.8 18.2 3,572 363 196
Jan-10 10.4 14.1 3,500 337 248
Dec-09 15.1 9.9 3,382 224 341
Nov-09 11.9 6.6 3,693 311 556
Oct-09 8.0 8.0 3,825 477 477
Sep-09 8.3 9.2 3,970 480 430
Aug-09 9.1 8.0 4,089 448 508
Jul-09 8.8 8.1 4,146 469 510
Jun-09 7.9 7.9 4,180 529 530
May-09 8.3 11.6 4,241 508 366
Apr-09 9.9 13.1 4,149 420 317
Mar-09 9.5 13.2 3,916 413 297
Feb-09 11.7 15.7 3,731 318 238
Jan-09 12.5 16.1 3,622 290 225
Dec-08 15.3 12.9 3,646 239 282
Nov-08 16.0 13.1 3,925 245 300
Oct-08 14.4 12.1 4,086 283 337
Sep-08 11.5 9.8 4,081 354 418
Aug-08 11.1 7.7 4,031 364 522
Jul-08 8.6 7.6 4,170 484 551
Jun-08 9.4 7.4 4,299 457 579
May-08 8.4 9.3 4,291 512 459
Apr-08 7.5 9.1 4,130 552 452
BrokerMetrics® 2 of 2 05/24/10
Information not guaranteed. © 2010 - 2011 Terradatum and its suppliers and licensors (http://www.terradatum.com/metrics/licensors).